Table of Contents
- Introduction and scope
- The challenge
- Unuseful approaches
- Grafana and Saltstack
- Alerting with Grafana
- Roundup
- References (Links to GitHub for code examples)
This is not meant to be a conventional how-to, but strategic advice to help you find the best fit for your challenge.
Due to a long-standing operating system upgrade I needed to perform, I decided it was time to take a look at modern monitoring tools to replace the existing ones running on that system. Two tools I wanted to replace in particular were Nagios (partially) and its pluggable partner component PNP4Nagios. There’s a lot more to be done with that system, because of how it fits in our company processes, but I’ll explain that later in this article. As it turns out, after a thorough comparison with other options, Grafana became my tool of choice. Especially in combination with Influxdb (see: References) and Telegraf agents, better known as the TIG stack, the possibilities for further insight are endless.
One last thing before I take off: I hope you find my research and methodology useful to help you in your challenges. And, of course, feel free to make comments below or get in touch with me if you have questions.
Introduction and scope
To provide an understanding of this migration process, I will give a summary of the current setup and which process elements were needed in the new design. The monitoring components of this system involve Nagios (see: References) and PNP4Nagios (see: References). The first of these, a well-known monitoring system, is very robust and is responsible for our main monitoring and alerts. Its role in a nutshell: when a system is down, Slack and SMS messages are sent to the engineer dealing with the case. The PNP4Nagios part is integrated in Nagios and is used to render graphs based on RRDtool.
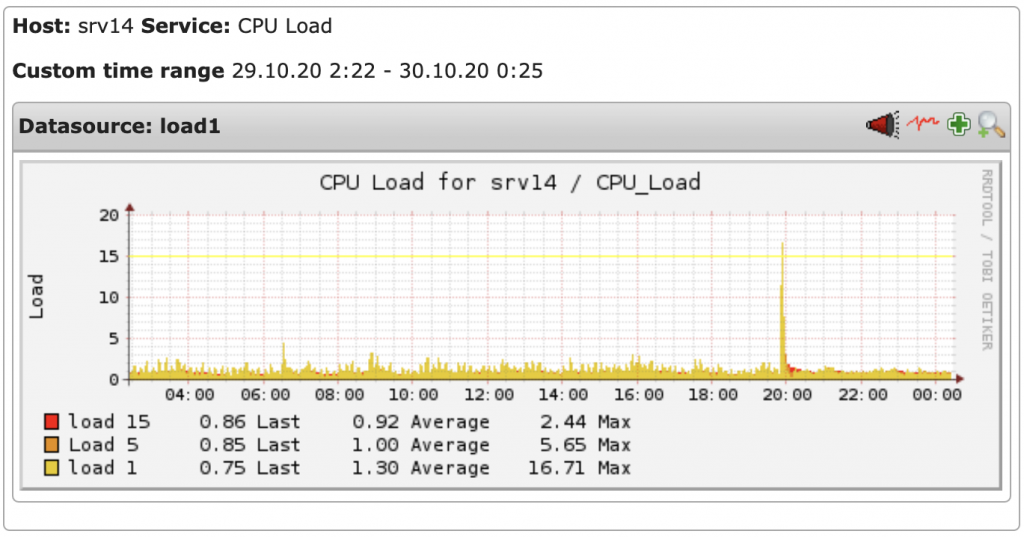
Dated graph rendering example by PNP4Nagios
In sum, the two main business processes on which this endeavor is focused are monitoring (active state as well as trends over time) and alerting people when issues occur. We automate everything as much as we can by following best practices from DevOps (see: References) and SRE (see: References). Considering both of those, we provision everything with SaltStack. As this is our tool of choice for central system and configuration management, the new design must fall within these parameters.
This article focuses on management of the systems running our customer websites. We run fully automated provisioning from a central Django-based management application. Auto-installing a new website affects system components throughout our infrastructure though. The components affected range from incorporating it in nightly backups, monitoring performance, adding it to centralized update tasks, etcetera. One of the reasons I chose this use case as the basis for this article is mainly the scale of the task, meaning there would be no way of doing all this manually.
The challenge
We wanted everything we already had, but more and better. Grafana has functional limitations, for which we needed to find solutions. You’ll read more about those below, as well as some of the approaches we attempted but didn’t manage to see them through. So… we know what we want and we know what we’re going to use: Grafana. However, the major challenge is that it has to fit in with all the existing systems and business processes.
After initiating a new website installation from our management platform, we need the following items when monitoring that website:
- http status – we remotely check each website to see whether it returns a 200. If not, we call somebody
- search string found – we search page content to make sure certain functionalities work (e.g. form rendering)
- response time – we want to know if a website starts to lag (over time)
- bytes sent – we want to know how much data is sent out over the network
- access log hits over time – do the bytes sent correlate to the number of log hits?
- error log hits over time – do updates or changes made by customers result in errors?
And, more importantly, all this should of course have a stable trustworthy alert process behind it when issues occur or thresholds are reached.
In a nutshell, when invoking a website installation, customer data from our Django application is fed to SaltStack, which in turn renders a new dashboard that needs to be fed with the metrics mentioned above displayed in a Grafana dashboard. The upshot and a few examples of the code are provided further down. I also describe two failed attempts, so others can decide according to their own project whether this might fit in with their needs. Otherwise, you could go for the scalable solution, that we have implemented ourselves.
Unuseful approaches
As is often the case, I tried several different means of going about this. There were two solutions that did not seem to fit our needs, mainly because they introduced extra dependencies and/or a higher level of complexity that would lower overall maintainability. Even so, I thought it might be useful to explain those, because they might work for you if your project is scaled differently.
Grafana has several brilliant features that we wanted to apply. One of those is the ‘repeat’ function. Create a row (or single graph) with a set of relevant graphs and configure that row as repeatable.
Grafana graph/row repeater
In our case, when we selected several customer domain names (FQDNs) from the dropdown list, Grafana simply repeated the row with graphs for every selected domain.
Grafana multi-selection from dropdown list
Great, because this applies the DRY (‘don’t repeat yourself’) principle. This dropdown list makes use of ‘template variables’ and is generated by a simple query.
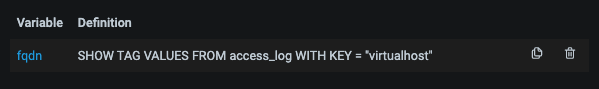
FQDN as a Grafana template variable
However, there’s one major problem. Alerts can’t be set for graphs when they’re configured as ‘repeatables’. What? Yes, that’s right, you can’t! Given that manually adding the website graphs on this scale is not an option, we needed to figure out another way to do it. Incidentally, other people also seem to be struggling with achieving a satisfactory result. See: References to community post. What we came up with was rendering a dashboard JSON and uploading it via the Grafana API.
jsonnet/grafonnet
While JSON is not the most user-friendly format, rendering the JSON file with additional tools and or libraries seems the obvious next step. For rendering files that include variables, loops, etc., there’s a broad selection of tools to choose from. One example well known among developers is the Jinja template engine. You build a base template with code blocks and variable names, and get a properly rendered html file without getting your hands dirty every time.
Something similar is available for JSON, and it’s called jsonnet. On top of that, there are additional libraries out there that instantly add functionality to jsonnet so it can quickly render JSON ‘code’ for specific purposes. One of these libraries is Grafonnet (see: References), which instantly adds rendering blocks in the form of Grafana dashboard components.
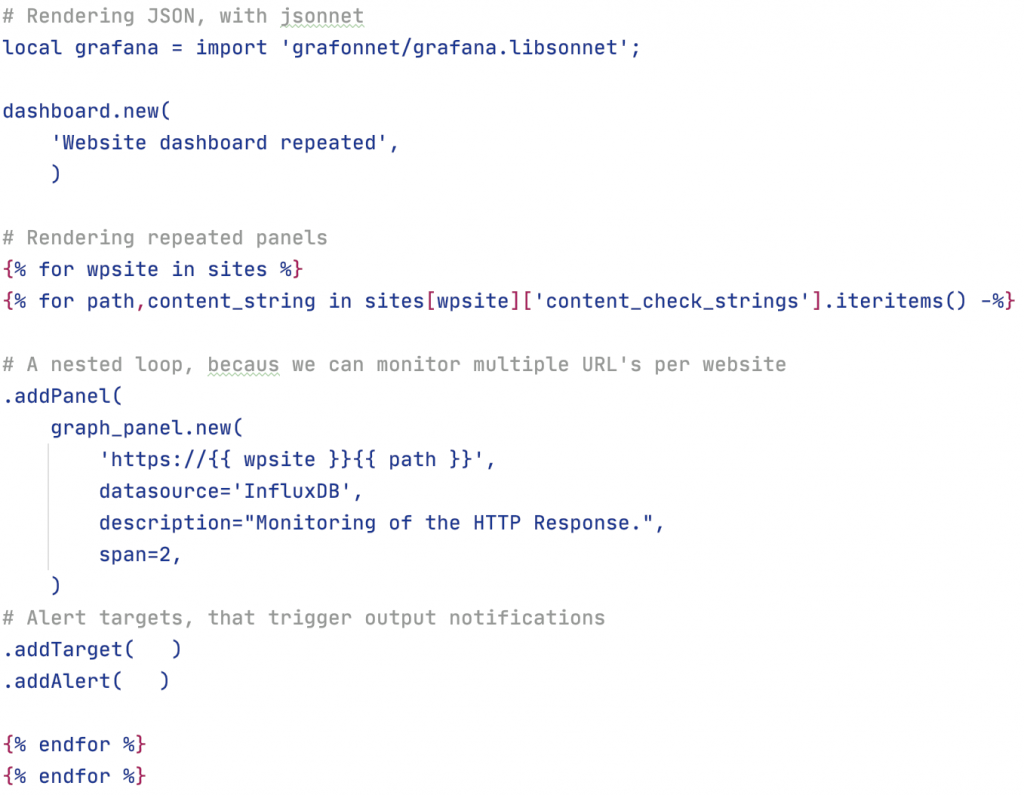
Very readable and it seemed too good to be true and in my case, it really was. Mind you, it might well work on a different scale and at a lower level of specificity. However, I needed to use features of Grafana that weren’t supported in Grafonnet yet. It looked like the features of Grafana are developed a quicker than they’re implemented in Grafonnet. I figured I also have the luxury of working with SaltStack, with which we do almost everything. So I also have Jinja at my disposal. As such, I decided I might as well take the well-trodden path to render the end result that way.
Salt/Jinja loops in JSON
I initially designed a nested JSON setup, with included files like the Jinja templating handles for the Django framework. The setup looked like this:
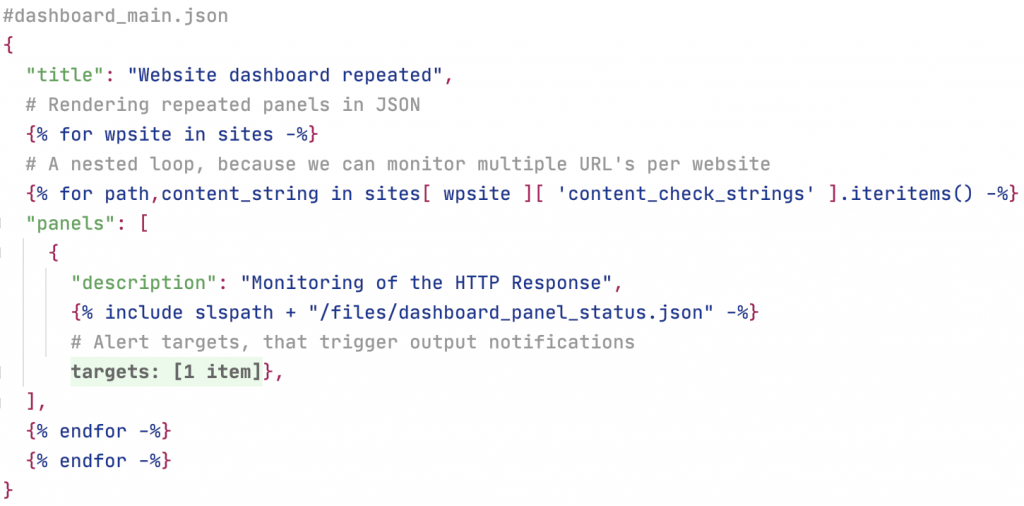
The nested include files in the JSON template were done like this:

At first, this seemed like the way to go, as Grafana handles the dashboard IDs very neatly. If they aren’t there, Grafana generates them, and if they are the revision number is increased. But regretfully that is not how it works for panel IDs. So, a humble attempt was made to generate these in SaltStack during the rendering of the file. However, that would have meant writing an extra (Python-based) execution module, because the value in the loop is yielded and does not increase with each iteration as you would expect when you look at the code. Bummer, because writing a python module would deviate too much from the scope of the project, introducing another layer of complexity. Furthermore, my syntax highlighting plugin in Pycharm goes completely berserk trying to parse complex nested ninja tags in a JSON file. And as we’ve said, the setup had to be maintainable over time.
Grafana and Saltstack
At this point, I found myself at a dead end and needed to see things on a wider scale. After fiddling around a bit more in Grafana, I discovered that the alerts panel in Grafana can be configured to show only dashboard alerts from a specific folder. Hang on a minute… then came the light bulb moment. If I render one dashboard per website and group all the dashboards in one Grafana folder, we’re there. That would give a good signal/noise ratio for the intended website monitoring output channel.
So, back to SaltStack. If one of the only variables in the dashboard.json is a website’s fully qualified domain name (FQDN), it’s simpler to keep it as a JSON template and render them into a working end result. So, the basis for this template was simply a full working Grafana dashboard including all the alerts for a specific website domain. To get the template I wanted, I set up all the panels and alerts I wanted, then exported that dashboard to a JSON file. The only thing I needed to do, was to replace all the domain name instances with a placeholder like “{{ site_fqdn }}”. With that template setup, the loop in the Salt state file also looks very clean.
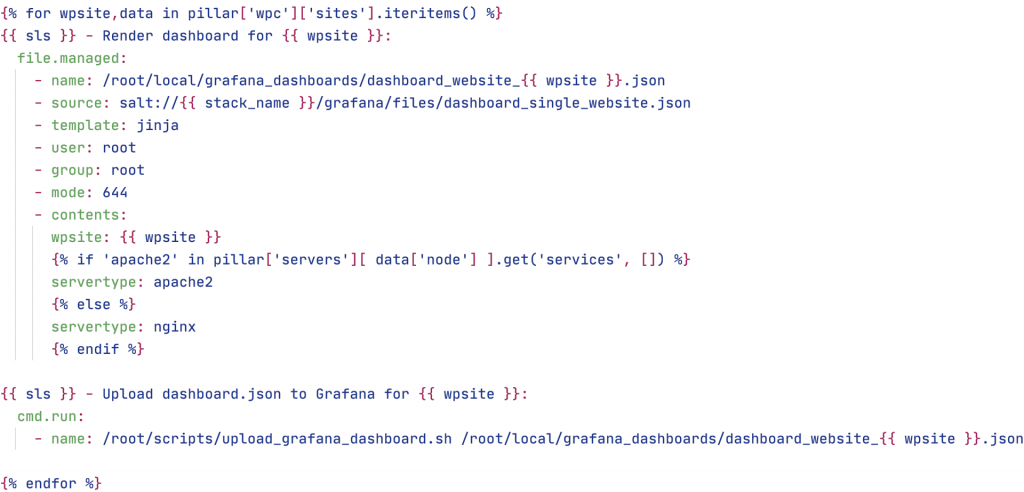
So in the simplest sense, this is what to do:
- Create a dashboard with all the graphs and alerts you want
- Export the dashboard to a JSON file
- Replace all the website domain name occurrences with “{{ fqdn }}”
- Using SaltStack, render the JSON files for all the individual sites (with the snippet above)
- Upload to the server running TIG/Grafana
- Also have the loop in the Salt state file execute the script (see: References) that injects the dashboard for every website.
The reason I choose this solution, which I try to do for all aspects of automation, is that the technical depth balances with the width. That means it’s easy to maintain, even if you don’t see the actual code for months. The rule is: never go too wide and never go too deep. In practice, try to avoid too many underlying dependencies. Also, don’t use too many small tools alongside each other because any single one of them can break the chain and disrupt the process.
Alerting with Grafana
So now that we have our deployment code and dashboards covered, another important aspect is the process for alerts when things go awry. Our starting point was Nagios, which by the way, we still keep running for other high priorities and system monitoring, despite it being something of a dinosaur now. Even so, it remains one of the most robust monitoring and alerts systems out there, one I would never lose sleep over, at least as long as no alerts are triggered. Given that we depend heavily on it for continuity for ourselves and for our customers, we needed a replacement that could do the job just as well.
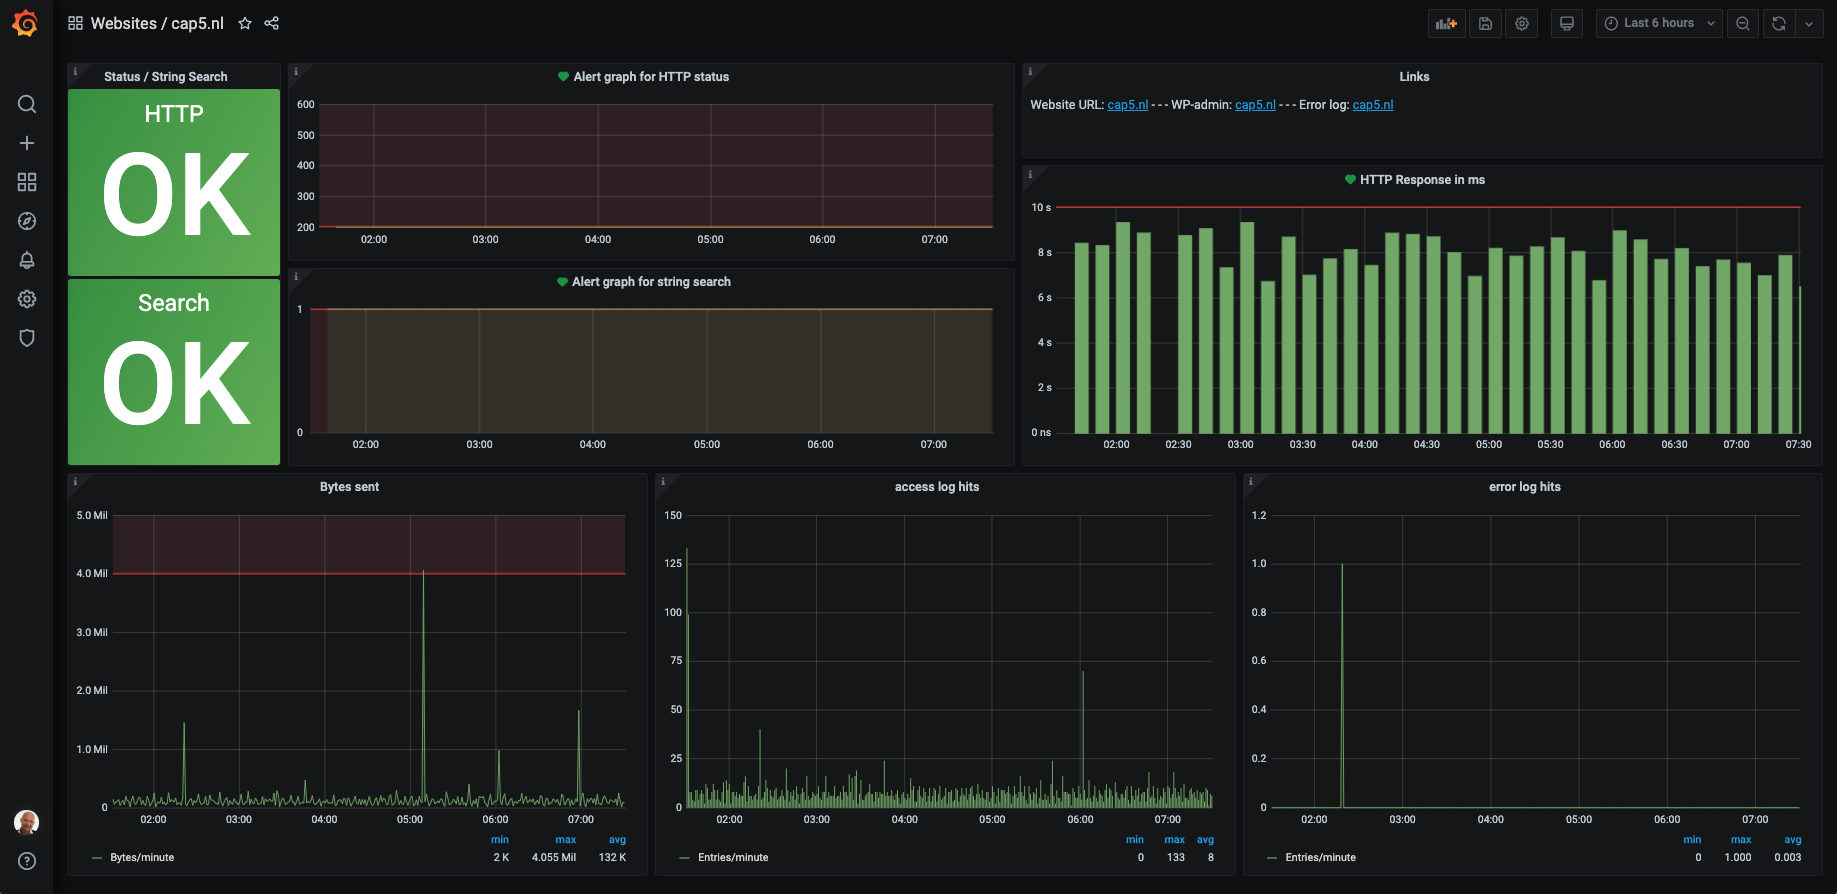
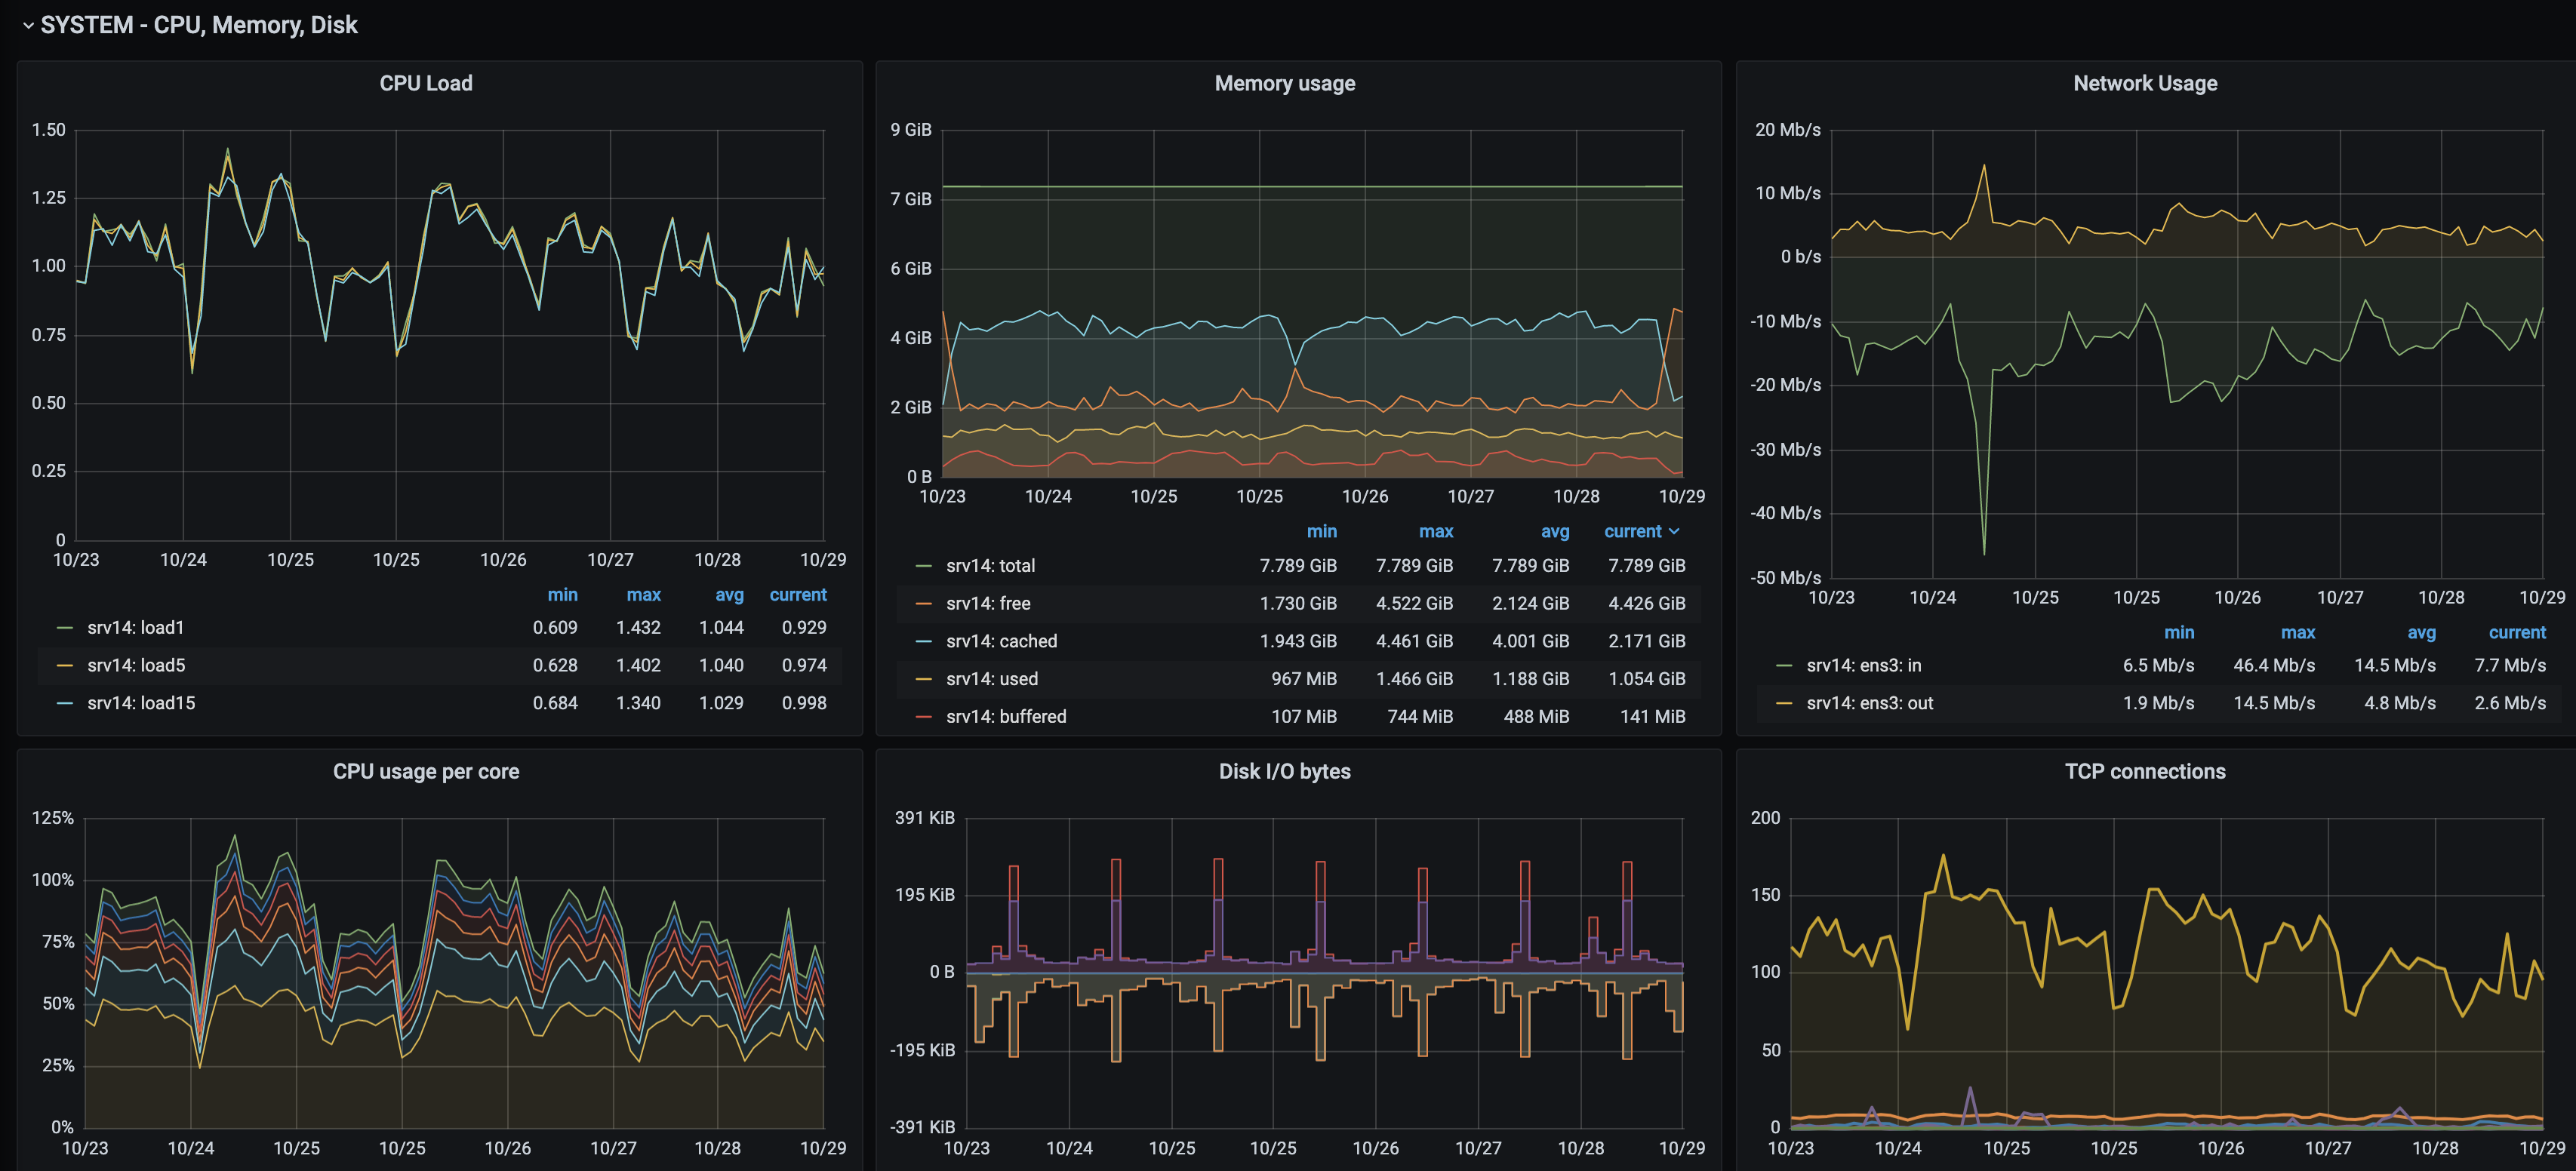
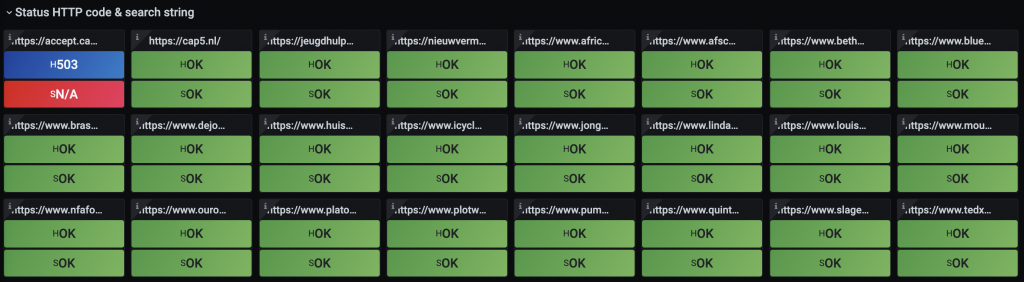
Grafana single website dashboard with alert status
Grafana was already my tool of choice, but we still needed to get this last and most important aspect dealt with too. While setting up and testing the alerts in Grafana, I encountered a few major caveats, with the community urgently requesting to have them fixed. However, with no solution for these in hand, I couldn’t switch to the new setup. The issues were:
- Alerts can not be triggered from dashboard control panels using template variables.
- Alerts are only possible on graph-type panels
- Grouping of alert types is impossible within a dashboard that combines servers and websites metrics
The first of these: basically any repeatable configuration, which is a big plus in itself for Grafana, means alerts can’t be created for the graphs or the objects they display. Come again? Yes, everything you want to be alerted about on a dashboard needs to be set up without using template variables. Even worse, most graph types do not allow alerts to be set up, whether it’s website availability (the big green OK shown in the dashboards above), a heat map or whatever else you want to see. You always need to set up a regular graph so you can set an alert for the metric in question.
The second and third issues: apart from having to duplicate existing panels into graph-type ones, I also wanted to group the website-related alerts separately from other cloud and priority production system alerts. I wanted to be able to produce different alert output channels for both server managers and webmasters, despite a regular expression (RegEx) alert filtering configuration being possible, something I’m normally a big fan of. The side effect would be a tech depth that wouldn’t make any contribution to the reliability of the whole.
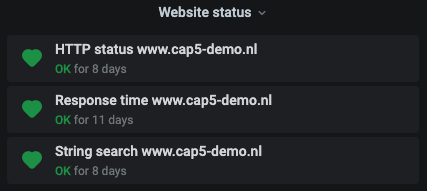
Grafana website alert listing
Back to our chosen solution: with one ‘dashboard per website’ and a folder containing all of them, I realized it was pretty straightforward. In the alert panel filter, all you need to do is select the folder you want alerts to be displayed for. Hang on though, you might think that’s information pull, so you look at the panel to see if something has gone amiss. How about information push? After all, you want to be notified when something goes wrong. Exactly! We have Slack output configured as a notification channel. So we simply configured that in our default website dashboard. After uploading them, that was then the case for all the websites (since they are in a Grafana folder).
One quick point of semantics, expressed in more of a personal capacity. Although the setup is now similar, if not identical to the one in Nagios, I mostly view the alert stream in Slack. It felt like I was looking more at the transition of alerts rather than the state they were in. I could always access their state from the alerts panel on the home dashboard. However, when the process is operational, the operator is often more involved with their phone than their laptop, plus it’s easier to interface via a Slack channel than it is to use a full-on Grafana dashboard on your mobile.
Roundup
Well, there we have it. If a new website is ordered:
- One of our people enters the customer and website information in our Django-based management application
- This data is extracted, categorized into tasks and placed in the Celery task management system
- These tasks invoke the execution of several Salt state files
- One of the tasks is to import the generated dashboard.json file into Grafana via the API
- Then all the monitoring and alerts are in place for the new website
While I’ve learned a lot from the attempts that didn’t make it into the actual setup, I can proudly say we got the job done. I’d say modularity and simplicity is key! The more detailed the complexities and dependencies you add, the more costly it is to maintain. As for development, the same principle goes as for operations: KISS (‘keep it simple, stupid’).
I hope you find these insights and snippets of code useful. If you’d like to provide feedback or need help setting something similar up, feel free to get in touch with us.
Happy automating!
References
- Git repository with code examples: https://github.com/cap5bv/saltstack-grafana-tech-post/
- Community discussion: https://community.grafana.com/t/grafana-dashboards-as-code-for-newcomers/5334/
- DevOps explained: https://en.wikipedia.org/wiki/DevOps
- Google SRE concept: https://landing.google.com/sre/
- Grafana: https://grafana.com/
- InfluxDB: https://www.influxdata.com/
- Grafonnet: https://github.com/grafana/grafonnet-lib
- Nagios: https://www.nagios.org/projects/
- PNP4Nagios: https://docs.pnp4nagios.org/start